In this article, we will try to interpret a few Attention maps and understand the insights we can extract.
Let’s start testing 🎉
First Example
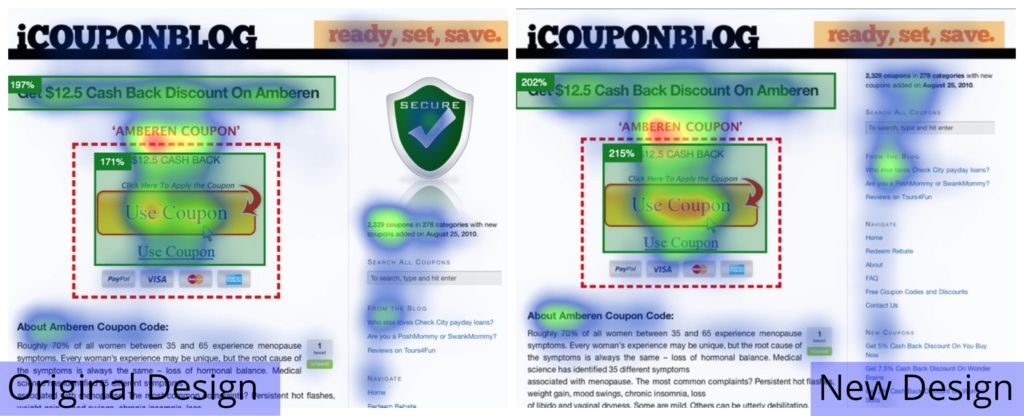
400% Increase in CTR in iCouponBlog
Source : 100 Conversion Optimization Case Studies

It was clear from the Attention Maps that by removing the enormous Secure logo, the attention distribution changed.
The primary CTA (“Use Coupon”) area got more attention, jumping from 171% to 215%, meaning a higher probability of a user to notice. It is essential to take care of the dilution of our user’s attention.
Second Example
Co-founder’s blog Source: All posts | Product E:ngineer
This example is quite impressive. Below is a mobile landscape screenshot from one of our co-founder’s blog.

Now, as a designer, I would suspect that the “Product Engineer” headline would get a ton of attention.
But the results proved me wrong. And there is a reason for the results below.
The headline is only 2 words long; thus, they do not require too much cognitive effort and attention.
But the subtitle below is >20 words long, thus requiring more cognitive effort to read!

Third Example
Information Flow
Source : E-food.gr application
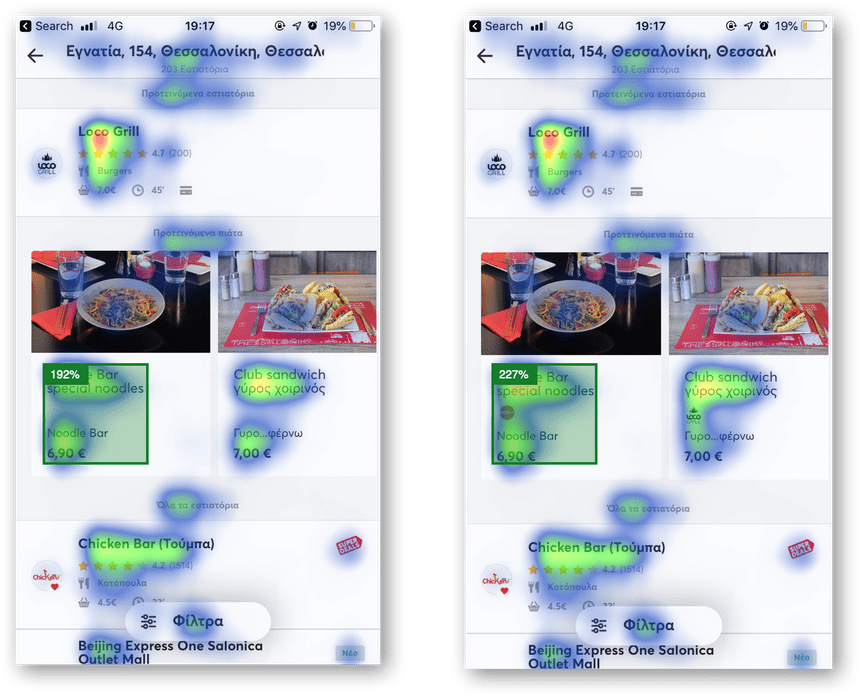
Below you see two screens, the original and a proposed one for a food delivery application. Sorry for the Greek text, but this is a powerful example worth mentioning.
The main difference below are the logos between the Dish titles and the Store titles in the recommended dishes.

Now if we check the Areas of Interest, we can see that by placing the logos, we grub the attention of the user, thus leading to more conversion to the advertised dishes.

Also, if you check the Attention maps per se, you can see that in the proposed, the Attention Map creates one cluster, leading to better information flow. In contrast, the original screen has two clusters.

