Foody was looking for ways to test feature images of stores, and help the storeowners of their marketplace sell more and serve their clients better. They found that A/B testing could solve this problem, but for each test, they would require at least 2 weeks of testing and a lot of traffic to have a statistical significance which was not workable.
Led by Panayiotis Pavlides, UX designer at Foody, the company launched a project to measure the effect featured images have on business metrics. Using VisualEyes, Foody managed to firstly predict and then confirm the outcomes of the research:
- VisualEyes’ winning featured images contributed to a 33% conversion rate increase for the tested stores.
- An average of 116% increase in Per Session Goal Value for the stores.
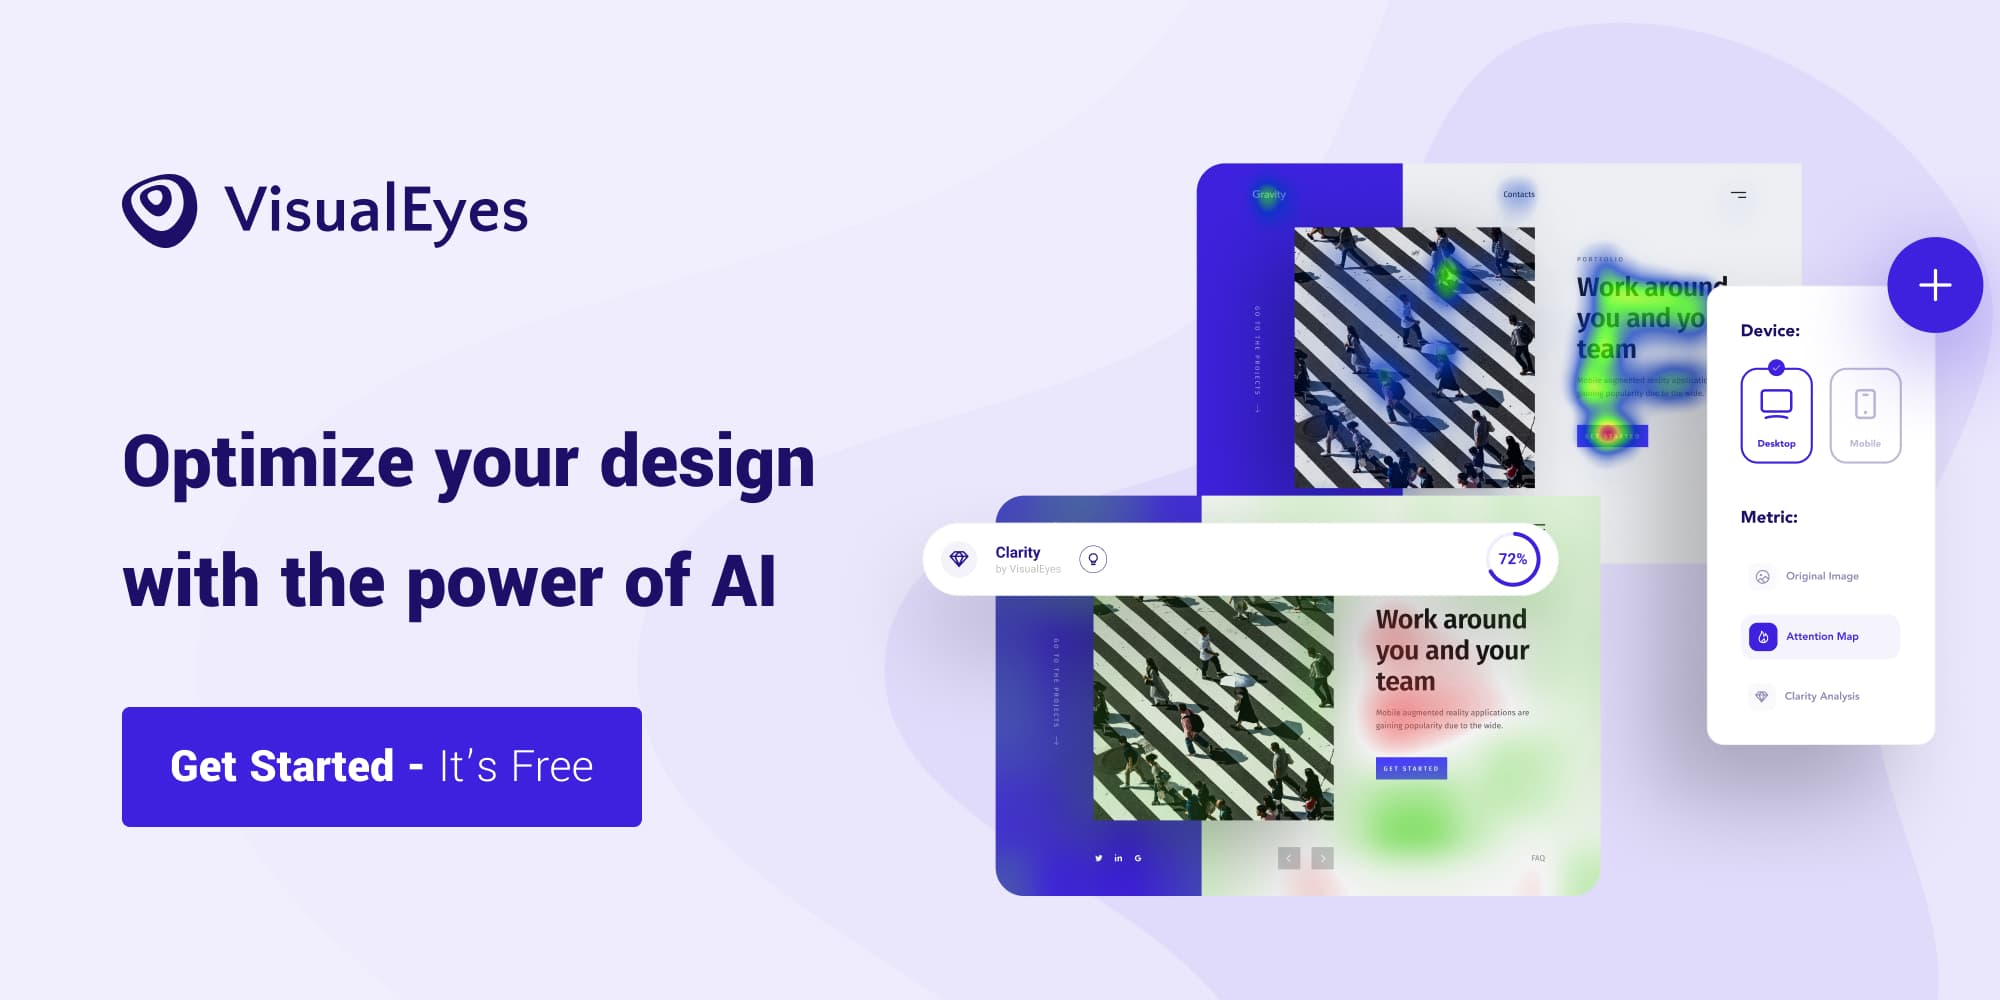
Foody’s methodology for testing with VisualEyes
Before Foody’s team started testing their designs, they created an experimentation process to get credible results.
In the first step, they searched for stores with high enough traffic. High traffic would enable Foody’s team to validate their assumptions faster and measure how their changes would affect each store’s conversions.

After finding high traffic stores, they handpicked the stores that had a featured image with low Clarity Score, thus a better opportunity to increase the Clarity of the creative.
In the last step, they picked stores that matched the criteria mentioned above, and they started testing new images, that eventually would increase the Clarity Score of the designs. They were testing images either provided by the store owners or from stock photos.

When they found images that increased Clarity Score enough (2-3 points on average) they published the new featured images on production and started measuring the conversions. Foody’s team waited for at least 2 weeks, to account for cyclical variation in web traffic, as suggested from Google.
The numbers
Then the results arrived with a surprising uplift in every single store they changed it’s featured image.
Foody’s team notice a 33% conversion rate increase on average on the stores that they changed the featured image.
Additionally, they noticed an average of 116% increase in Per Session Goal Value for every store. An increase to celebrate 🎉
This is the Aesthetic Usability effect in practice! A more aesthetically pleasing image contributed to higher conversions and more value for each session.
What’s next
The next step in Foody’s team is to remove individual biases in Design Critiques and eliminate guesswork. They want to onboard the marketing team on VisualEyes’ platform and establish a company-wise culture of experimentation. To enable this, Foody is taking advantage of VisualEyes’ plugins and platform.
In Short
- Small enhancements, Clarity Score-wise, might reflect on better conversion rates and have a major impact in your KPIs.
- Aesthetically pleasing and clean design can be a credibility establisher in modern products.
- A/B testing on production needs at least two weeks of traffic, but we can be confident to release effective versions of our products and creatives with predictive testing.
- Make your own experimentation process. Different industries and products have their own KPIs and way of defining success. Optimise and measure what you care most about.